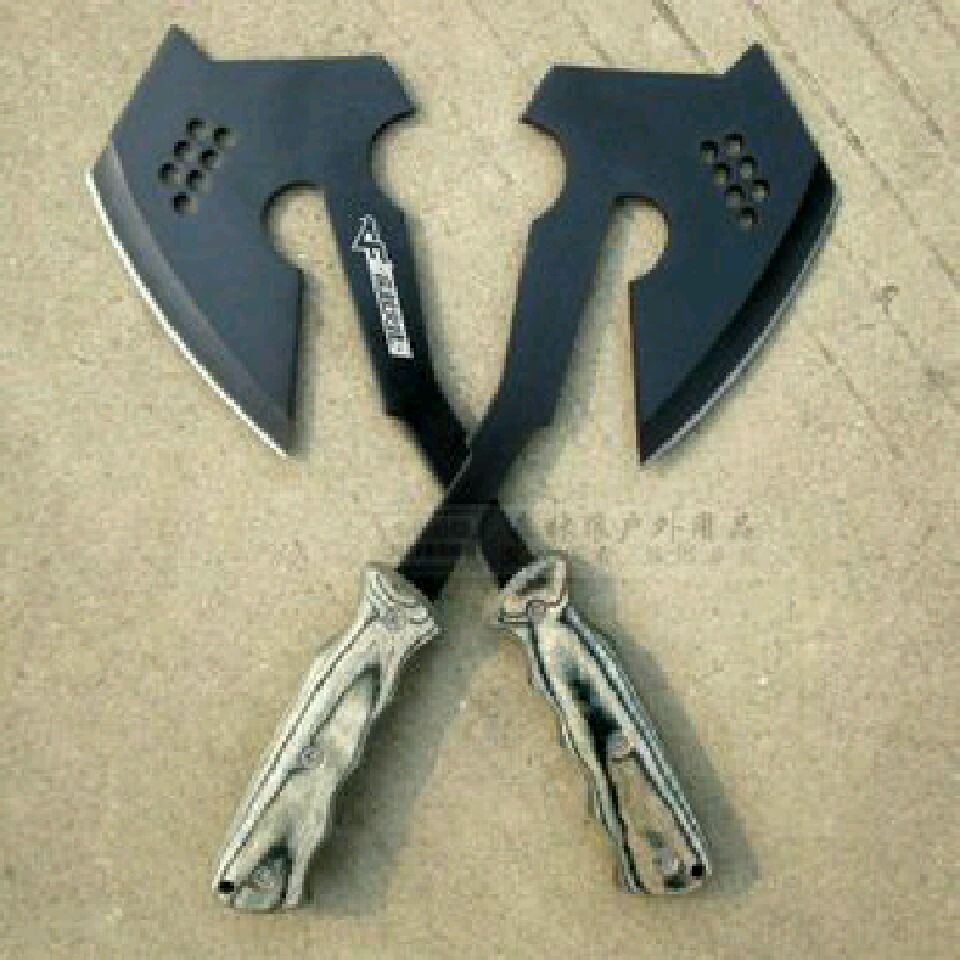
a = 1.2;
tu2 = Plot[a x^2 - 2 r/3, {x, -1.1, 1.1}];
tu3 = Plot[0.7 (x + 3.5 r)^2 - 0.8, {x, -2, 1}];
tu4 = Plot[0.7 (x - 3.5 r)^2 - 0.8, {x, 0, 2}];
r = 3/4;
tu1 = ParametricPlot[{{r Cos[t] - 1.2 r, r Sin[t]}, {r Cos[t] + 1.2 r,
r Sin[t]}}, {t, 0, 2 Pi}];
tu5 = Plot3D[0, {x, -2.2 r, 2.2 r}, {y, -0.8, 0},
RegionFunction ->
Function[{x, y,
z}, ((x + 1.2 r)^2 +
y^2 >= (r)^2) && (((x - 1.2 r)^2 + y^2 >= (r)^2)) && (y <
a x^2 - 2 r/3) && (y < 0.7 (x + 3.5 r)^2 - 0.8) && (y <
0.7 (x - 3.5 r)^2 - 0.8)], BoxRatios -> Automatic]; tu6 =
Plot3D[(-(x + 1.2 r)^2 - y^2 + (3/4)^2), {x, -2, 2}, {y, -1, 1},
RegionFunction ->
Function[{x, y,
z}, ((x + 1.2 r)^2 + y^2 <= (3/4)^2) && (y <=
a x^2 - 2 r/3) && (y <= 0.7 (x + 3.5 r)^2 - 0.8)],
BoxRatios -> Automatic];
tu7 = Plot3D[(-(x - 1.2 r)^2 - y^2 + (3/4)^2), {x, -2, 2}, {y, -1, 1},
RegionFunction ->
Function[{x, y,
z}, ((x - 1.2 r)^2 + y^2 <= (3/4)^2) && (y <=
a x^2 - 2 r/3) && (y <= 0.7 (x - 3.5 r)^2 - 0.8)],
BoxRatios -> Automatic];
tu8 = Show[tu5, tu6, tu7, PlotRange -> {{-3, 3}, {-2, 2}, {-1, 1}}];
tu9 = ParametricPlot3D[{{1.01 + r, 2 Cos[t],
0.8 Sin[t] - 0.75}, {-1.01 - r, 2 Cos[t],
0.8 Sin[t] - 0.75}}, {t, -3 Pi/5, 1.15 Pi/3}, {r, 0, 0.1},
Mesh -> False];
tu10 = ParametricPlot3D[{2 Cos[t], r, 1.1 Sin[t] - 0.6}, {t, 4.8 Pi/6,
Pi + 7.2 Pi/6}, {r, -0.8, -.2}];
Show[tu8, tu9, tu10, PlotRange -> {{-3, 3}, {-2, 2}, {-2, 1}}]
2014年11月10日 14点11分
14

用单函数画不出来的不稀奇
2014年11月11日 03点11分



![[真棒]](/static/emoticons/u771fu68d2.png)


![[滑稽]](/static/emoticons/u6ed1u7a3d.png)


![[阴险]](/static/emoticons/u9634u9669.png) 人才
人才

![[黑线]](/static/emoticons/u9ed1u7ebf.png)

![[委屈]](/static/emoticons/u59d4u5c48.png)