level 1
东方鸿94
楼主
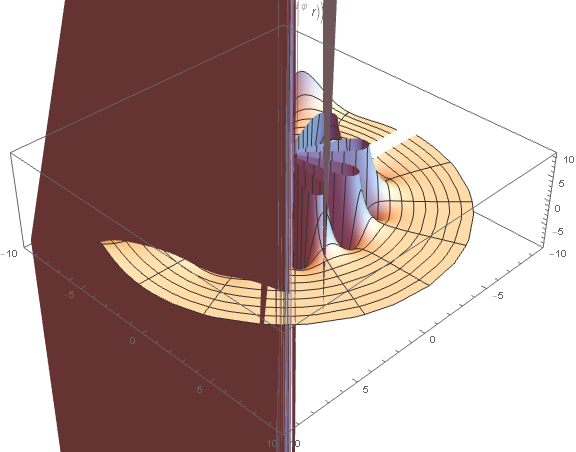 用mathematica三维绘图,出现上面两幅图这种情况是怎么回事呀?怎么解决?
ReHankelH1[n_] :=
RevolutionPlot3D[
Re[HankelH1[n, r*Exp[I*\[CurlyPhi]]]], {r, 0, 10}, {\[CurlyPhi], 0,
2 Pi}, ImageSize -> Large,
PlotLabel -> Re[HankelH1[n, r*Exp[I*\[CurlyPhi]]]],
PlotRange -> {{-10, 10}, {-10, 10}, {-10, 10}},
PlotStyle -> RGBColor[1, 1, 1], MaxRecursion -> 6,
ViewPoint -> {Right, Above, Back}]
ReHankelH1[9]