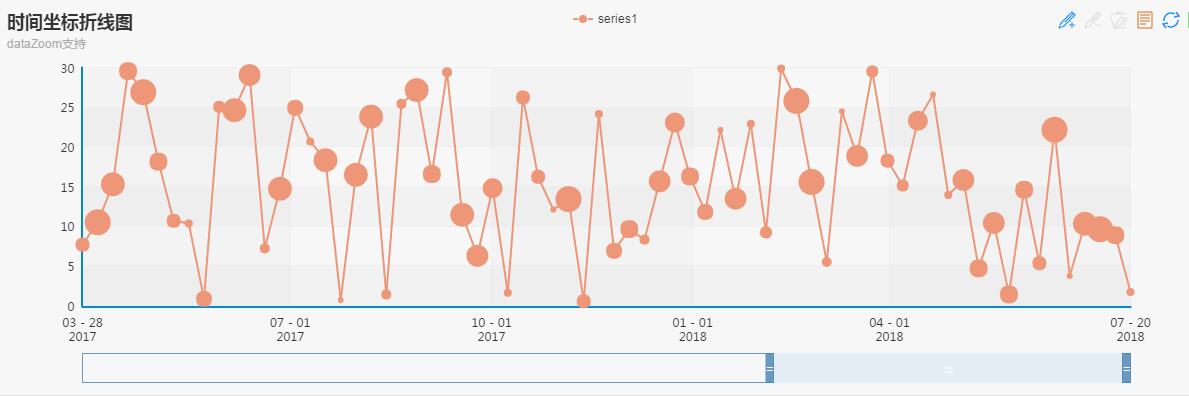
echarts中x轴类型为time时如何显示多条曲线?
echarts吧
全部回复
仅看楼主
level 1
DivineHc
楼主
给的例子都是一条折线(如图),我想要画多条折线,怎么画呢?
2017年06月13日 12点06分
1
level 1
xuzhl2009
根据时间点抽出,然后每个时间点是一条线,放入series中。
可以参考
http://echarts.baidu.com/demo.html#bar1
2017年06月16日 09点06分
2
41155066
你这个例子type : 'category'
2018年02月27日 08点02分
level 1
我媳妇叫大牙😺
series里面多写一个就行了
2019年02月22日 09点02分
3
1