
level 2
我想领个证
楼主
想做成这个样子的
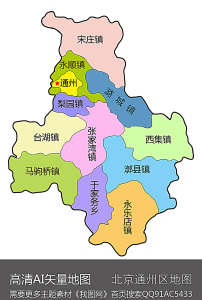 可是我的水平就只做出来了个框框而已,没有里面的具体每个街道,下面是我的代码,怎么改才能实现,谢谢大家了
myChart = echarts.init(document.getElementById('main'));
myChart.showLoading();
$.get('tongzhou.json', function (geoJson) {
myChart.hideLoading();
echarts.registerMap('tongzhou', geoJson, {
'张家湾镇': {
left: -131,
top: 25,
width: 15
}
});
myChart.setOption(option = {
title: {
text: '通州区'
},
tooltip: {
trigger: 'item',
formatter: '{b}<br/>{c} (p / km2)'
},
toolbox: {
show: true,
orient: 'vertical',
left: 'right',
top: 'center',
feature: {
dataView: {readOnly: false},
restore: {},
saveAsImage: {}
}
},
visualMap: {
min: 800,
max: 50000,
text:['High','Low'],
realtime: false,
calculable: true,
color: ['orangered','yellow','lightskyblue']
},
series: [
{
name: '通州区',
type: 'map',
mapType: 'tongzhou', // 自定义扩展图表类型
itemStyle:{
normal:{label:{show:true}},
emphasis:{label:{show:true}}
},
data:[
],
// 自定义名称映射
nameMap: {
}
}
]
});
});
2016年05月23日 03点05分
1
可是我的水平就只做出来了个框框而已,没有里面的具体每个街道,下面是我的代码,怎么改才能实现,谢谢大家了myChart = echarts.init(document.getElementById('main'));
myChart.showLoading();
$.get('tongzhou.json', function (geoJson) {
myChart.hideLoading();
echarts.registerMap('tongzhou', geoJson, {
'张家湾镇': {
left: -131,
top: 25,
width: 15
}
});
myChart.setOption(option = {
title: {
text: '通州区'
},
tooltip: {
trigger: 'item',
formatter: '{b}<br/>{c} (p / km2)'
},
toolbox: {
show: true,
orient: 'vertical',
left: 'right',
top: 'center',
feature: {
dataView: {readOnly: false},
restore: {},
saveAsImage: {}
}
},
visualMap: {
min: 800,
max: 50000,
text:['High','Low'],
realtime: false,
calculable: true,
color: ['orangered','yellow','lightskyblue']
},
series: [
{
name: '通州区',
type: 'map',
mapType: 'tongzhou', // 自定义扩展图表类型
itemStyle:{
normal:{label:{show:true}},
emphasis:{label:{show:true}}
},
data:[
],
// 自定义名称映射
nameMap: {
}
}
]
});
});