
level 11
贴吧用户_0Et917U
楼主
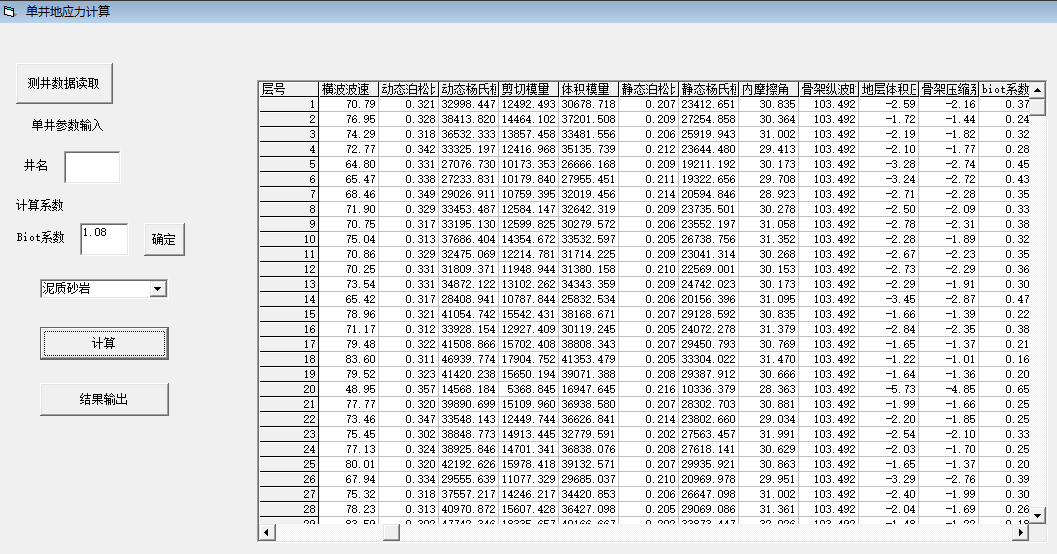
已经用VB读取了一个excel表,想利用表中一列的数据来制做折线图,用哪个控件?picturebox还是mschart?如果用的话,哪位能给说一下具体用法啊,我百度的资料都讲的不太明白(还是我理解力比较堪忧。。),或者哪位好心给个讲解的链接也行啊。如图
 Private Sub Command1_Click()
CommonDialog1.CancelError = True
'设置标志
CommonDialog1.Flags = cdlOFNHideReadOnly
'设置过滤器
CommonDialog1.Filter = "全部文件|*.*|表格文件|*.xls|"
'设置缺省的过滤器
CommonDialog1.FilterIndex = 2
CommonDialog1.ShowOpen
Dim ExcelApp As Excel.Application
Set ExcelApp = CreateObject("excel.application")
ExcelApp.Workbooks.Open (CommonDialog1.FileName)
With MSFlexGrid1
.Rows = ExcelApp.Sheets(1).UsedRange.Rows.Count
.Cols = 100
For r = 0 To .Rows - 1
For c = 2 To .Cols
If c = 2 Then
.TextMatrix(r, c - 2) = ExcelApp.Sheets(1).Cells(r + 1, c - 1)
Else
.TextMatrix(r, c - 2) = ExcelApp.Sheets(1).Cells(r + 1, c - 1)
End If
Next
Next
End With
ExcelApp.Quit
End Sub
这是读取的程序
2015年12月01日 08点12分
1
Private Sub Command1_Click()CommonDialog1.CancelError = True
'设置标志
CommonDialog1.Flags = cdlOFNHideReadOnly
'设置过滤器
CommonDialog1.Filter = "全部文件|*.*|表格文件|*.xls|"
'设置缺省的过滤器
CommonDialog1.FilterIndex = 2
CommonDialog1.ShowOpen
Dim ExcelApp As Excel.Application
Set ExcelApp = CreateObject("excel.application")
ExcelApp.Workbooks.Open (CommonDialog1.FileName)
With MSFlexGrid1
.Rows = ExcelApp.Sheets(1).UsedRange.Rows.Count
.Cols = 100
For r = 0 To .Rows - 1
For c = 2 To .Cols
If c = 2 Then
.TextMatrix(r, c - 2) = ExcelApp.Sheets(1).Cells(r + 1, c - 1)
Else
.TextMatrix(r, c - 2) = ExcelApp.Sheets(1).Cells(r + 1, c - 1)
End If
Next
Next
End With
ExcelApp.Quit
End Sub
这是读取的程序

![[滑稽]](/static/emoticons/u6ed1u7a3d.png) 前排
前排


![[吐舌]](/static/emoticons/u5410u820c.png)


![[哈哈]](/static/emoticons/u54c8u54c8.png)


![[黑线]](/static/emoticons/u9ed1u7ebf.png)
![[惊哭]](/static/emoticons/u60cau54ed.png)