3. Experimental Section
3.1. Snake Venom Gland cDNA Synthesis and Sequencing
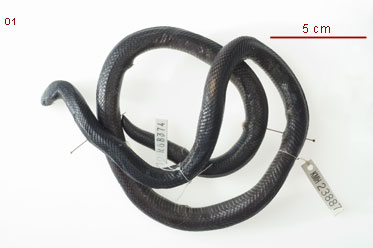
The two venom glands were dissected and immediately frozen in liquid nitrogen and stored at −80 °C from a unique male specimen of Atractaspis aterrima collected alive in Tanzania and kindly provided byAlpha Biotoxine Company. The two non-elongate venom glands were later ground under liquid nitrogen. From the tissue powder, total RNAs were isolated using the mirVanamiRNA isolation kit (Ambion). The total RNA fraction was examined by capillary electrophoresis using Bioanalyzer (Agilent). The total RNA poly(A) was split in two samples for the construction of normalized and non-normalized libraries. First-strand cDNA synthesis was primed with a N6 randomized primer. Then 454 adapters A and B were ligated to the 5' and 3' ends of the cDNA. The cDNA was finally amplified with PCR (21 cycles) using a proof reading enzyme. For Titanium sequencing the cDNA in the size range of 500–700
bp
was eluted from a preparative agarose gel. From this RNA pool, we generated a normalized and non-normalized library using standard protocols.
3.2. Bioinformatic Processing of the 454 Reads and Annotation of the Dataset
Sequences were trimmed to remove adapters and low quality regions. Reads were assembled using Newbler 2.3 (454 Life Science). An identity threshold of 98% was chosen for contig assembly with a minimal overlap of 40 bp. Open reading frames were predicted using GeneMark.hmm-E [26] and matching contigs and singletons of at least 60 amino acids in length were further annotated by similarity search on the NR database of GenBank, specifying an e-value cut-off of 1E−05. Snake venom gland-specific transcripts were then selected from best-BLAST hit descriptions using a list of keywords of all known toxin protein families described so far [18,27] in a broad range of venomous taxonomic groups. As most toxin sequences originate from duplication events of common cellular genes, retrieving toxin sequence by simple key-word search is highly prone to a false positive detection. To avoid this major pitfall, we trimmed putative toxins from the original list. We choose to select hits showing a best bidirectional BLAST hit on NR database. To analyze the diversity of the toxin repertory, stringent parameters were applied as following: exclusion of (i) truncated sequences, (ii) sequences with ambiguous positions, and (iii) sequences lacking a signal peptide after a SignalP software screening [28]. Nonetheless, we applied less stringent parameters for weakly expressed toxin families as we were sometimes unable to identify full-length sequences (see below). Information and datasets resultant from this project can be accessed from DDBJ/EMBL/GenBank under following accession numbers: Bioproject PRJNA210890, Biosample SAMN02230181, Sequence Read Archive (SRA) SRR931902 and Transcriptomic Shotgun Assembly SUB296805 and SUB291519.
3.3. Functional Annotation of Contigs
To characterize the major transcripts of the venom gland transcriptome, we have chosen to describe the most abundant transcripts representing 80% of the dataset using reads from non-normalized library. Although the relationship between the number of transcripts and the corresponding amount of protein expressed is not always linear, analysis of transcripts covering 80% of reads assembled into contigs can nevertheless highlight the key molecular components of venom production as well as the main compounds of the venom cocktail. The distribution of functional categories for COGs, KOs, NOGs, and Subsystems at the highest level supported by these functional hierarchies was processed after the BLAST step against NR protein database.
3.4. Prediction of Non-Matching Sequences
Several studies have shown that transcriptomes include a large number of uncharacterized sequences whose function is still unknown. These sequences can cover several categories of transcripts including mainly non-coding RNAs [20]. We were particularly interested in the presence of transcripts which do not show strong similarities (e-value threshold set to 1E-05) with proteins or sequences already identified. For this, we combined the use of homemade software, which analyzes BLAST results, Signal P outputs and an optional detection of cysteine patterns. In the case of a venom gland, the detection of a transcript corresponding to a secreted protein suggests that the protein is most likely a toxin as the common core of the vertebrate genome is relatively well characterized. We completed these initial criterions by using the transcript levels associated with each of the new candidates to select the most relevant ones. The general EST processing workflow is described in detail in Figure 6.

Figure 6. EST processing workflow.
Click here to enlarge figure
3.5. Diversity Analysis Using Evolutionary Networks
Phylogenetic analysis of toxins remains the gold standard to estimate sequence diversity and evolutionary processes. Unfortunately such analysis can lead to unresolved topologies for the following reasons: (1) the toxins are mainly small peptides, and (2) they are often very diverse. Consequently, alignments produced for a given family are generally of low quality and the number of positions available to produce informative phylogenetic analysis supported is insufficient. This gives rise to the production of non-informative topologies. In order to the nature of these sequences, we chose to adopt a network analysis. To form the data set, we imported the curated sequences of toxins available on Uniprot (named ToxProtDB, [29]) and we produced a non-redundant data set using cd-hit clustering software [30]. These sequences were blasted on predicted ORFs to retrieve Atractaspis aterrima putative toxins. After being assured by a reciprocal blast on the NR Genbank database that these candidates were indeed potential toxins, we analyzed the full dataset following a standard protocol [31]. Networks were further visualized using Cytoscape [32].
3.6. Selection Analyses
The influence of natural selection on Atractaspis 3FTx was evaluated using maximum-likelihood models [33,34] implemented in CODEML of the PAML [35]. We employed site-specific models that estimate positive selection statistically as a non-synonymous-to-synonymous nucleotide-substitution rate ratio (ω) significantly greater than 1. We compared likelihood values for three pairs of models with different assumedω distributions as no a priori expectation exists for the same: M0 (constant ω rates across all sites) versusM3 (allows the ω to vary across sites within “n” discrete categories, n ≥ 3); M1a (a model of neutral evolution), where all sites are assumed to be either under negative (ω < 1) or neutral selection (ω = 1), versusM2a (a model of positive selection), which in addition to the site classes mentioned for M1a, assumes a third category of sites; sites with ω > 1 (positive selection) and M7 (Beta) versus M8 (Beta and ω), and models that mirror the evolutionary constraints of M1 and M2 but assume that ω values are drawn from a beta distribution [36]. Only if the alternative models (M3, M2a, and M8: allow sites with ω > 1) show a better fit in Likelihood Ratio Test (LRT) relative to their null models (M0, M1a, and M7: do not show allow sites ω > 1), are their results considered significant. LRT is estimated as twice the difference in maximum likelihood values between nested models and compared with the χ2 distribution with the appropriate degree of freedom—the difference in the number of parameters between the two models. The Bayes empirical Bayes (BEB) approach [37] was used to identify codon sites under positive selection by calculating the posterior probabilities that a particular amino acid belongs to a given selection class (neutral, conserved or highly variable). Sites with greater posterior probability (PP ≥ 95%) of belonging to the “ω > 1 class” were inferred to be positively selected.
In addition, Fast, Unconstrained Bayesian Approximation (FUBAR) approach implemented in HyPhy package [38,39] was employed to provide additional support to the aforementioned analyses and to detect sites evolving under pervasive diversifying and purifying selection pressures. We also employed Mixed Effects Model Evolution (MEME) [39] to detect sites evolving under the influence of episodic diversifying selection. To clearly depict the pro-portion of sites under different regimes of selection, an evolutionary fingerprint analysis was carried out using the ESD algorithm implemented in datamonkey [40]. We also employed branch-site REL (BSR) test [41] implemented in HyPhy to identify lineages diversifying under the influence of episodic selection pressure.
3.7. Structural Analyses
To depict the influence of natural selection pressures on the evolution of Atractaspis 3FTx, we mapped the sites under positive selection on the homology model created using Phyre 2 webserver [42]. Pymol 1.3 [43] was used to visualize and generate the images of homology models. Consurf webserver [44] was used for mapping the evolutionary selection pressures on the three-dimensional homology models.