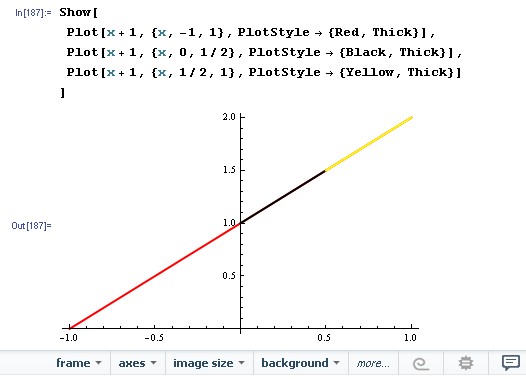
level 1
color[x_] :=
Piecewise[{{Red, -1 <= x < 0}, {Black, 0 <= x < 1/2}, {Yellow,
1/2 <= x < 1}}];
Plot[x + 1, {x, -1, 1}, ColorFunction -> (color[#1] &),
ColorFunctionScaling -> False, PlotPoints -> 100]
2014年11月25日 04点11分
3

这个给力,在区间分太多的情况下,比Show好很多
![[真棒]](/static/emoticons/u771fu68d2.png)
吧务
level 11
Plot[x + 1, {x, -10, 10}, ColorFunction -> (Hue[#] &)]
2014年11月25日 07点11分
4
这个不是可控的吧,比如一个图,我要它在区间(2,3)上是蓝色,在(3,4)上是红色……
![[不高兴]](/static/emoticons/u4e0du9ad8u5174.png)
回复 ldz880508 : Plot[x + 1, {x, -5, 5}, Mesh -> 9, PlotStyle -> Thick, MeshFunctions -> {#1 &}, MeshShading -> {Red, Blue}] 呢
2014年11月25日 10点11分