Mat src = imread("corn.bmp");
Mat gray[3];
int color_r_u = 175,color_g_u=135,color_b_u=102;//玉米的颜色
int color_r_d = 135,color_g_d=115,color_b_d=93;//玉米的颜色
Mat dst[3];
int kernel_size = 3;
int scale = 1;
int delta = 0;
int ddepth = CV_16S;
Mat abs_dst,ldst;
//滤波
GaussianBlur( src, src, Size(3,3), 0, 0, BORDER_DEFAULT );
//将图像分为RGB进行处理
split(src,gray);
imshow("b",gray[0]);
imshow("g",gray[1]);
imshow("r",gray[2]);
Laplacian( gray[0], ldst, ddepth, kernel_size, scale, delta, BORDER_DEFAULT );
convertScaleAbs( ldst, abs_dst );
imshow("src",abs_dst);
//求图像的直方图
/// 设定bin数目
int histSize = 255;
/// 设定取值范围 ( R,G,B) )
float range[] = { 0, 255 } ;
const float* histRange = { range };
bool uniform = true; bool accumulate = false;
Mat r_hist, g_hist, b_hist;
/// 计算直方图:
calcHist( &gray[2], 1, 0, Mat(), r_hist, 1, &histSize, &histRange, uniform, accumulate );
calcHist( &gray[1], 1, 0, Mat(), g_hist, 1, &histSize, &histRange, uniform, accumulate );
calcHist( &gray[0], 1, 0, Mat(), b_hist, 1, &histSize, &histRange, uniform, accumulate );
// 创建直方图画布
int hist_w = 400; int hist_h = 400;
double bin_w = ( (double) hist_w/histSize );
Mat histImage( hist_w, hist_h, CV_8UC3, Scalar( 0,0,0) );
/// 将直方图归一化到范围 [ 0, histImage.rows ]
normalize(r_hist, r_hist, 0, histImage.rows, NORM_MINMAX, -1, Mat() );
normalize(g_hist, g_hist, 0, histImage.rows, NORM_MINMAX, -1, Mat() );
normalize(b_hist, b_hist, 0, histImage.rows, NORM_MINMAX, -1, Mat() );
/// 在直方图画布上画出直方图
for( int i = 1; i < histSize; i++ )
{
line( histImage, Point( bin_w*(i-1), hist_h - cvRound(r_hist.at<float>(i-1)) ) ,
Point( bin_w*(i), hist_h - cvRound(r_hist.at<float>(i)) ),
Scalar( 0, 0, 255), 2, 8, 0 );
line( histImage, Point( bin_w*(i-1), hist_h - cvRound(g_hist.at<float>(i-1)) ) ,
Point( bin_w*(i), hist_h - cvRound(g_hist.at<float>(i)) ),
Scalar( 0, 255, 0), 2, 8, 0 );
line( histImage, Point( bin_w*(i-1), hist_h - cvRound(b_hist.at<float>(i-1)) ) ,
Point( bin_w*(i), hist_h - cvRound(b_hist.at<float>(i)) ),
Scalar( 255, 0, 0), 2, 8, 0 );
}
line(histImage, Point( bin_w*(color_r_u), 1), Point( bin_w*color_r_u, hist_h), Scalar( 0, 0, 255), 1, 8, 0 );
line(histImage, Point( bin_w*(color_r_d), 1), Point( bin_w*color_r_d, hist_h), Scalar( 0, 0, 255), 1, 8, 0 );
line(histImage, Point( bin_w*(color_g_u), 1), Point( bin_w*color_g_u, hist_h), Scalar( 0, 255, 0), 1, 8, 0 );
line(histImage, Point( bin_w*(color_g_d), 1), Point( bin_w*color_g_d, hist_h), Scalar( 0, 255, 0), 1, 8, 0 );
line(histImage, Point( bin_w*(color_b_u), 1), Point( bin_w*color_b_u, hist_h), Scalar( 255, 0, 0), 1, 8, 0 );
line(histImage, Point( bin_w*(color_b_d), 1), Point( bin_w*color_b_d, hist_h), Scalar( 255, 0, 0), 1, 8, 0 );
Mat thresh[3];
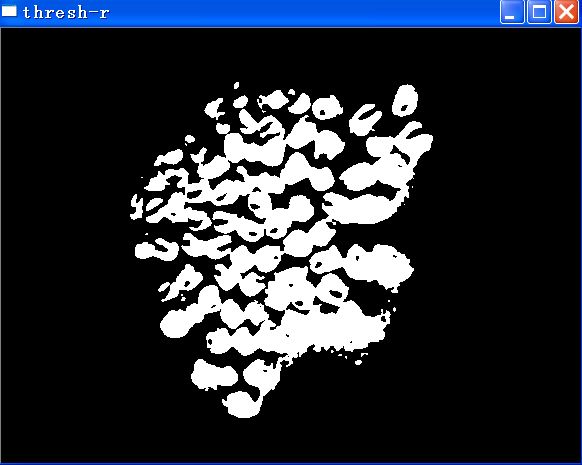
threshold(gray[2], thresh[2], color_r_u, 255, THRESH_TOZERO);
threshold(thresh[2], thresh[2], color_r_d, 255, THRESH_BINARY);
threshold(gray[1], thresh[1], color_g_u, 255, THRESH_TOZERO);
threshold(thresh[1], thresh[1], color_g_d, 255, THRESH_BINARY);
threshold(gray[0], thresh[0], color_b_u, 255, THRESH_TOZERO);
threshold(thresh[0], thresh[0], color_b_d, 255, THRESH_BINARY);
// adaptiveThreshold(gray[2], thresh[2],255,ADAPTIVE_THRESH_MEAN_C,THRESH_BINARY,5,2);
// adaptiveThreshold(gray[1], thresh[1],255,ADAPTIVE_THRESH_MEAN_C,THRESH_BINARY,5,2);
// adaptiveThreshold(gray[0], thresh[0],255,ADAPTIVE_THRESH_MEAN_C,THRESH_BINARY,5,2);
Mat out;
merge(thresh,3,out);
//add(thresh[0], thresh[1], out);
//add(thresh[2], out, out);
imshow("hist",histImage);
imshow("thresh-r",thresh[2]);
imshow("thresh-g",thresh[1]);
imshow("thresh-b",thresh[0]);
//Mat countours,hierarchy;
//findContours(thresh[2],countours,hierarchy,CV_RETR_EXTERNAL,CV_CHAIN_APPROX_SIMPLE,Point(0,0));
int x,y;
int area=0;;
for(x=0;x<thresh[2].cols;x++)
for(y=0;y<thresh[2].rows;y++)
{
Scalar intensity = thresh[2].at<uchar>(y, x);
int val = intensity.val[0];
if(val>=255) area++;
}
int num=area/530;
CString numStr;
numStr.Format(_T("%d"),num);
imshow("dst", out);
AfxMessageBox(numStr);
2014年01月28日 02点01分
10
是总面积/单个玉米面积530
2017年01月09日 00点01分


![[滑稽]](/static/emoticons/u6ed1u7a3d.png)


![[惊讶]](/static/emoticons/u60cau8bb6.png)
![[乖]](/static/emoticons/u4e56.png)